A Temperature-Entropy (T-S) diagram is a graphical representation that shows the relationship between temperature (T) and entropy (S) for a substance, typically used in thermodynamics to analyze energy transfer system cycles. In the case of water and steam, the T-S diagram is particularly useful because it allows visualization of the heat transfer and the work done by or on the system during various processes.
where:
- ( s ) is the specific entropy of the mixture
- ( x ) is the quality of the mixture (the fraction of the mass that is steam)
- ( s_g ) is the specific entropy of the saturated vapor
- ( s_f ) is the specific entropy of the saturated liquid
- ( s_{fg} ) is the specific entropy change of vaporization
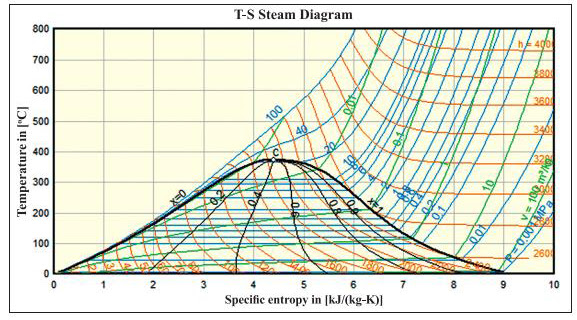
The area under the curve on a T-S diagram represents the heat transferred to or from the system during a process. For pure substances like water, the T-S diagram can show different phases and transitions, such as the critical point and the triple point.
In engineering and thermodynamics, T-S diagrams are essential tools for analyzing cycles like vapor power cycles, gas power cycles, and refrigeration cycles. They help in understanding the thermodynamic properties and processes of the working fluid, which could be an ideal gas or involve phase changes.
Key features and uses of a T-S diagram for steam:
Phase Regions: The T-S diagram typically includes regions representing the different phases of steam: solid (ice), liquid (water), and vapor (steam). Each phase region is defined by its temperature and entropy values.
Saturation Lines: Saturation lines on the T-S diagram represent the equilibrium conditions between two phases of steam (e.g., liquid-vapor equilibrium). These lines delineate the boundary between the liquid and vapor phases and indicate the temperature and entropy values at which phase changes occur.
Isobaric and Isothermal Lines: Isobaric lines represent constant pressure lines, while isothermal lines represent constant temperature lines. These lines help visualize the effect of pressure and temperature changes on the thermodynamic state of steam.
Specific Processes: Different thermodynamic processes, such as heating, cooling, compression, and expansion, can be represented as paths or trajectories on the T-S diagram. Analyzing these processes in the T-S diagram helps understand the changes in temperature, entropy, and other properties during the process.
Efficiency Analysis: T-S diagrams are commonly used in the analysis of thermodynamic cycles, such as the Rankine cycle used in steam power plants. By tracing the cycle path on the T-S diagram, engineers can evaluate the efficiency and performance of the cycle and identify opportunities for optimization.
T-S diagrams are valuable tools in thermodynamics, heat transfer, and fluid mechanics, providing engineers and scientists with a visual representation of the thermodynamic behavior of substances like steam. They facilitate analysis, design, and optimization of various systems and processes involving steam and other fluids.


No comments:
Post a Comment